Edexcel IGCSE Biology revision

Inheritance questions

Work with genes, alleles and genetic crosses, then use evidence to explain variation and natural selection.

Edexcel IGCSE Biology Subtopic 3.b

Inheritance syllabus

Questions on inheritance can test recall, calculations, explanations, diagrams, data handling and practical skills. You should be able to:

  • 3.14 define the genome and explain that a gene is a section of DNA coding for a specific protein.
  • 3.15 locate genes on chromosomes in the nucleus.
  • 3.16B describe the DNA double helix and complementary base pairs: A with T, and C with G.
  • 3.17B describe RNA as single stranded, with uracil instead of thymine.
  • 3.18B describe transcription and translation, including mRNA, ribosomes, tRNA, codons and anticodons.
  • 3.19 explain how alternative alleles produce differences in inherited characteristics.
  • 3.20 define dominant, recessive, homozygous, heterozygous, phenotype and genotype.
  • 3.21B define codominance.
  • 3.22 explain that most phenotypic features involve polygenic inheritance.
  • 3.23 draw genetic diagrams for monohybrid inheritance.
  • 3.24 interpret family pedigrees.
  • 3.25 predict probabilities from monohybrid crosses.
  • 3.26 describe the XX and XY sex chromosomes.
  • 3.27 use a genetic diagram to show sex determination at fertilisation.
  • 3.28 explain how mitosis produces two cells with identical chromosome sets.
  • 3.29 relate mitosis to growth, repair, cloning and asexual reproduction.
  • 3.30 explain how meiosis produces four genetically different haploid gametes.
  • 3.31 explain genetic variation through random fertilisation.
  • 3.32 know the human diploid number, 46, and haploid number, 23.
  • 3.33 distinguish genetic and environmental causes of variation.
  • 3.34 define mutation as a rare, random change in genetic material that can be inherited.
  • 3.35B link a DNA change to a changed amino acid sequence and phenotype.
  • 3.36B explain that mutations usually have no effect on phenotype, sometimes a small effect and rarely a significant effect.
  • 3.37B describe increased mutation rates from radiation, including gamma rays, X-rays and ultraviolet, and chemical mutagens such as those in tobacco.
  • 3.38 explain evolution by natural selection.
  • 3.39 explain increasing antibiotic resistance in bacterial populations and its consequences for treatment.

How to answer inheritance questions

  1. Use the correct sequence of events and distinguish chromosomes, genes, alleles and DNA.
  2. Define allele symbols, write parental genotypes and show gametes before completing a genetic cross.
  3. Separate genotype from phenotype and express probabilities in the form requested.
  4. For variation or selection, link the source of variation to survival, reproduction and allele frequency.

Inheritance example questions and worked answers

These examples show how information in a diagram, graph or experimental context becomes part of a complete exam answer.

Example 1: Comparing the outcomes of genetic crosses

Adapted from January 2017, Paper 1B · Question 4(a)

Question 1

Nile tilapia are fish. Their body colour is controlled by a single gene.

The allele N produces normal body colour and the allele n produces pink body colour.

Diagram 1 shows the phenotypes and the genotypes of Nile tilapia.
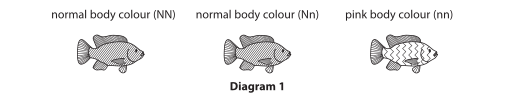
Diagram 1 showing three Nile tilapia phenotypes and genotypes: normal body colour (NN), normal body colour (Nn), and pink body colour (nn).

Diagram 2 shows all the possible crosses between the phenotypes and genotypes of Nile tilapia parents.
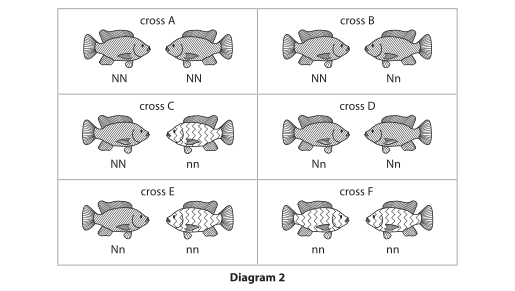
Diagram 2 showing six labelled Nile tilapia crosses, cross A to cross F, with the parent genotypes shown.

The table gives some descriptions of offspring.

Complete the table by giving the number of crosses that would produce each description of offspring. The first one has been done for you.

Description of offspring Number of
crosses
all are homozygous 2
50% are heterozygous
show a phenotype ratio of 1:1
have a genotype ratio of 1:1

Final answer

Description of offspringNumber of crosses
All are homozygous2
50% are heterozygous3
Show a phenotype ratio of 1:11
Have a genotype ratio of 1:12

Mark scheme points

  1. M1 Give 3 crosses for which 50% of the offspring are heterozygous.
  2. M2 Give 1 cross that produces a phenotype ratio of 1:1.
  3. M3 Give 2 crosses that produce a genotype ratio of 1:1.

Explanation

Since Nn fish have normal colour, N is dominant to n; only nn fish are pink. Check the offspring genotypes for each parental cross, then count how many crosses match each description.

  • NN × Nn produces equal numbers of NN and Nn offspring. Half are heterozygous, and the genotype ratio is 1:1.
  • Nn × Nn produces a 1 NN : 2 Nn : 1 nn genotype ratio, so 50% are heterozygous.
  • Nn × nn produces equal numbers of Nn and nn offspring. Half are heterozygous, the genotype ratio is 1:1, and the normal:pink phenotype ratio is 1:1.

Therefore, three crosses give 50% heterozygous offspring, two give a genotype ratio of 1:1, and one gives a phenotype ratio of 1:1.

Common mistakes

  • Count the number of crosses that match each description, not the number of offspring in a cross.
  • Keep genotype ratios (such as NN:Nn) separate from phenotype ratios (normal:pink).
Example 2: Plotting changes in peppered moth numbers

Adapted from January 2023, Paper 1B · Question 4(b)(i)

Question 2

The peppered moth is found in many countries.

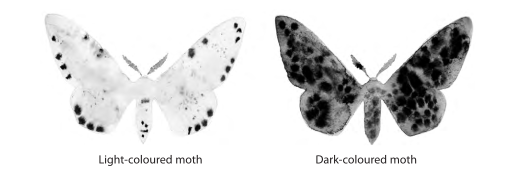
Two different forms of the peppered moth are a light-coloured moth and a dark-coloured moth.

The dark-coloured moth was first observed in cities when pollution, from burning coal, stained tree trunks black.

Photographs of a light-coloured moth and a dark-coloured moth, labelled Light-coloured moth and Dark-coloured moth.

(Source: © KBel/Shutterstock)

Scientists trapped moths in a city location from 1992 to 1998.

The table shows the scientists’ results.

Year Number of light-coloured moths Number of dark-coloured moths
1992927
19931118
1994117
199551
199614
199781
1998139

Plot a line graph to show the number of light-coloured moths and the number of dark-coloured moths from 1992 to 1998.

Use a ruler to join the points with straight lines.

Final answer

Use year on the horizontal axis and number of moths on the vertical axis. Use a linear vertical scale from 0 to 30, marked in equal intervals of 5. Plot both series accurately, join successive points with straight lines, and include a key.

1992199319941995199619971998YearNumber of moths 051015202530 Light-colouredDark-coloured
YearLight-coloured mothsDark-coloured moths
1992927
19931118
1994117
199551
199614
199781
1998139

Mark scheme points

  1. M1 Use a linear scale that covers at least half of the graph grid.
  2. M2 Join the plotted points with straight lines, with each line passing through all points in its series.
  3. M3 Put year on the horizontal axis and number of moths on the vertical axis, and label the axes.
  4. M4 Plot the points accurately, within half a small square of their correct positions.
  5. M5 Include a key identifying the light-coloured and dark-coloured moths, or label the lines directly.

Explanation

Use equal spacing for the years and a consistent, linear number scale. The plotted coordinates are (year, number of moths); plot both sets of values from the table. Join points only within the same moth-colour series using a ruler, then identify which line represents each series.

Common mistakes

  • The examiner report noted that students who missed marks often chose a scale that made the graph too small. Choose a scale that lets the data cover most of the grid.
  • Do not draw a bar chart or extend either line beyond the first or last plotted year.
  • Check that both lines are identified and that the axes show the correct quantities.

Practise Inheritance questions

Build a focused practice set from this part of the Edexcel IGCSE Biology syllabus.