Edexcel IGCSE Biology revision

Reproduction questions

Revise reproduction in plants and humans, from pollination and fertilisation to the role of hormones.

Edexcel IGCSE Biology Subtopic 3.a

Reproduction syllabus

Questions on reproduction can test recall, calculations, explanations, diagrams, data handling and practical skills. You should be able to:

  • 3.1 understand the differences between sexual and asexual reproduction
  • 3.2 understand that fertilisation involves the fusion of a male and female gamete to produce a zygote that undergoes cell division and develops into an embryo Flowering plants
  • 3.3 describe the structures of an insect-pollinated and a wind-pollinated flower and explain how each is adapted for pollination
  • 3.4 understand that the growth of the pollen tube followed by fertilisation leads to seed and fruit formation
  • 3.5 practical: investigate the conditions needed for seed germination
  • 3.6 understand how germinating seeds utilise food reserves until the seedling can carry out photosynthesis
  • 3.7 understand that plants can reproduce asexually by natural methods (illustrated by runners) and by artificial methods (illustrated by cuttings) Humans
  • 3.8 understand how the structure of the male and female reproductive systems are adapted for their functions
  • 3.9 understand the roles of oestrogen and progesterone in the menstrual cycle 3.10B understand the roles of FSH and LH in the menstrual cycle
  • 3.11 describe the role of the placenta in the nutrition of the developing embryo
  • 3.12 understand how the developing embryo is protected by amniotic fluid
  • 3.13 understand the roles of oestrogen and testosterone in the development of secondary sexual characteristics

How to answer reproduction questions

  1. Use the correct sequence of events and distinguish chromosomes, genes, alleles and DNA.
  2. Define allele symbols, write parental genotypes and show gametes before completing a genetic cross.
  3. Separate genotype from phenotype and express probabilities in the form requested.
  4. For variation or selection, link the source of variation to survival, reproduction and allele frequency.

Reproduction example questions and worked answers

These examples show how information in a diagram, graph or experimental context becomes part of a complete exam answer.

Example 1: Finding the time of pollen germination

Adapted from June 2015 (R), Paper 1B · Question 8(c)(ii)

Question 1

Pollen grains were placed in a solution that helps them to germinate (grow a pollen tube).

A microscope was used to observe the pollen grains for two hours.

The percentage of pollen grains that had started to germinate was measured during the two-hour period.

The graph shows the results.
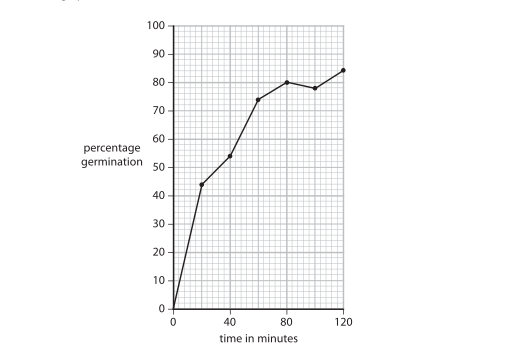
Graph of percentage germination against time in minutes, showing an overall increase with a slight decrease near the end.

The drawing shows pollen grains seen using the microscope at one time during the two hours.
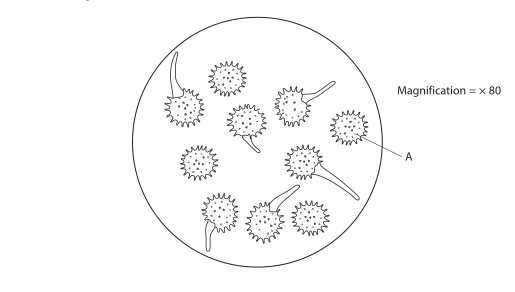
Circular microscope field containing pollen grains, some with pollen tubes; one grain is labelled A and the magnification is ×80.

Use the drawing and the graph to determine the time when these pollen grains were observed.

Show your working.

Answer minutes

Final answer

The pollen grains were observed at approximately 46 minutes.

6 of 10 pollen grains have started to germinate
(6 ÷ 10) × 100 = 60%
From the graph, 60% germination corresponds to approximately 46 minutes

Mark scheme points

  1. M1 Show 60% in the working.
  2. M2 Give a time from 44 to 48 minutes.

Explanation

Count the pollen grains that have a pollen tube: 6 out of the 10 shown. This is 60% germination. Then find 60% on the graph and read across to the time axis; this gives approximately 46 minutes.

Common mistakes

  • Counting the pollen grains without tubes as germinated, or using the number of tubes instead of the number of grains.
  • Giving the percentage but not using it to read the corresponding time from the graph.
Example 2: Linking puberty to changing hormone levels

Adapted from June 2021, Paper 1B · Question 7(c)

Question 2

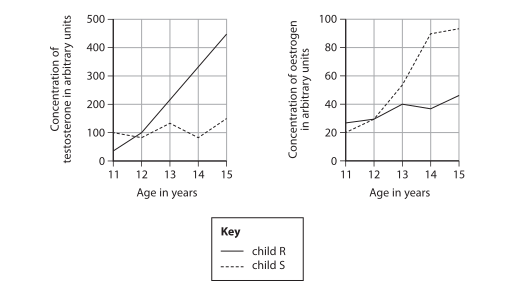
The graphs show changes in the concentrations of the hormones testosterone and oestrogen in two children, R and S, between the ages of 11 and 15.

Two line graphs showing changes in testosterone and oestrogen concentrations from age 11 to 15 for child R and child S, with a key identifying solid and dashed lines.

Explain how the changes in hormone concentrations affect the development of each child.

Final answer

Child R has a greater increase in testosterone and is male. This promotes male secondary sexual characteristics, such as a deeper voice and increased muscle. Child S has a greater increase in oestrogen and is female. This promotes female secondary sexual characteristics, such as breast development and wider hips.

Mark scheme points

Any four of the following points are needed for full marks:

  1. M1 Testosterone increases more in R than in S.
  2. M2 R is male and S is female.
  3. M3 Oestrogen increases more in S than in R.
  4. M4 R develops more muscle, a deeper voice or a beard.
  5. M5 S develops wider hips or breasts.
  6. M6 Body hair or a growth spurt develops.
  7. M7 Gamete production begins, or S starts to menstruate.
  8. M8 The changes are secondary sexual characteristics.

Explanation

Compare the hormone changes between the two children: testosterone increases more in R, while oestrogen increases more in S. These hormone patterns are consistent with R being male and S being female. During puberty, these hormones help bring about secondary sexual characteristics: examples include a deeper voice or increased muscle in R, and breasts or wider hips in S.

Common mistakes

  • Do not just say that hormone concentrations increase; state which hormone increases more in each child.
  • Link a development to the correct child—for example, breasts or wider hips in S, not R.

Practise Reproduction questions

Build a focused practice set from this part of the Edexcel IGCSE Biology syllabus.