Example 1: Working With Graphs
Question 1
A student wants to use a weighing scale to find the weight of her school bag.
She has a weighing scale marked in kilograms instead of newtons.
The weighing scale is not working properly.
With nothing hanging from it, the weighing scale shows 1.5 kg.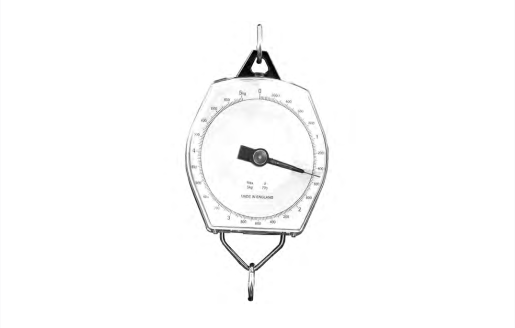 The student decides to check the weighing scale.
She has no accurate weights.
Instead, she puts some tins of beans in a plastic bag and hangs it from the scale.
Her readings are shown in the table.
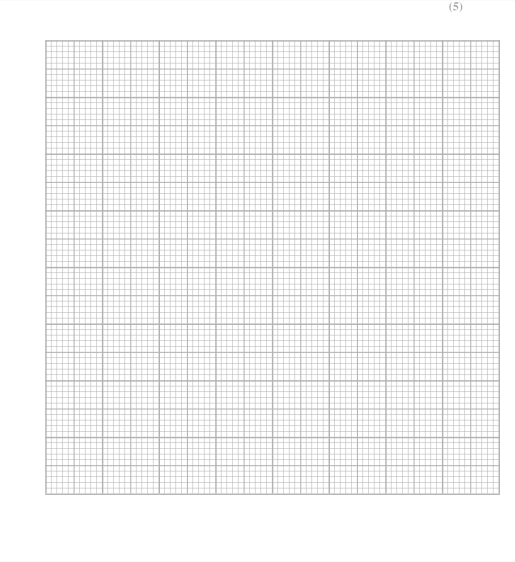
Draw a graph to show how the scale reading varies with the number of tins of
beans.
She has a weighing scale marked in kilograms instead of newtons.
The weighing scale is not working properly.
With nothing hanging from it, the weighing scale shows 1.5 kg.
The student decides to check the weighing scale.She has no accurate weights.
Instead, she puts some tins of beans in a plastic bag and hangs it from the scale.
Her readings are shown in the table.
| Number of tins of beans |
0 | 1 | 2 | 3 | 4 | 5 | 6 |
|---|---|---|---|---|---|---|---|
| Scale reading (in kg) |
1.5 | 2.0 | 2.3 | 2.8 | 3.7 | 3.5 | 3.9 |
beans.
Final answer
See graph.
Mark scheme points
- M1 Use linear scales on both axes.
- M2 Label the axes with the quantity, scale and unit: number of tins on the horizontal axis and scale reading / kg on the vertical axis.
- M3 Plot the seven readings accurately, to the nearest half-square. This plotting criterion is worth two marks.
- M4 Draw a straight line of best fit through the plotted points.
Explanation
Put the independent variable, the number of tins, on the horizontal axis. Put the measured scale reading on the vertical axis and include the unit kg. The chosen scales must increase by equal amounts for equal distances.
Plot these points:
- (0, 1.5), (1, 2.0), (2, 2.3), (3, 2.8)
- (4, 3.7), (5, 3.5), (6, 3.9)
Use a single straight line of best fit, rather than joining each pair of points with separate line segments. The line should have points reasonably balanced on either side.
Common mistakes
- Using an uneven scale, such as intervals of 1, then 2, then 5 squares.
- Swapping the axes or omitting the unit kg from the scale-reading axis.
- Plotting 2.3 kg, 3.7 kg or 3.9 kg at the nearest whole number instead of at the correct position.
- Joining the points dot-to-dot or drawing a bar chart instead of using one straight line of best fit.