Edexcel IGCSE Physics revision

Edexcel IGCSE Physics Movement and position questions

Revise the syllabus content for Movement and position, learn how to approach common exam questions, and study two worked examples with clear diagrams.

Edexcel IGCSE Physics Subtopic 1.b

Movement and position syllabus

Questions on movement and position can test recall, calculations, explanations, diagrams, data handling and practical skills. You should be able to:

  • 1.3 plot and explain distance−time graphs
  • 1.4 know and use the relationship between average speed, distance moved and time taken: average speed = distance moved / time taken
  • 1.5 practical: investigate the motion of everyday objects such as toy cars or tennis balls
  • 1.6 know and use the relationship between acceleration, change in velocity and time taken: acceleration = change in velocity / time taken a = (v − u) / t
  • 1.7 plot and explain velocity−time graphs
  • 1.8 determine acceleration from the gradient of a velocity−time graph
  • 1.9 determine the distance travelled from the area between a velocity−time graph and the time axis
  • 1.10 use the relationship between final speed, initial speed, acceleration and distance moved: (final speed)² = (initial speed)² + (2 × acceleration × distance moved) v² = u² + (2 × a × s)

How to answer movement and position questions

  1. Read both axes and their scales before taking a gradient or area from a graph.
  2. Choose a relationship that contains the quantity asked for and rearrange it before substituting.
  3. For force questions, state the direction as well as the size of a resultant or acceleration.
  4. Link each stage of an explanation: cause, physical change and observed outcome.

Movement and position example questions and worked answers

These examples show how information in a diagram, graph or experimental context becomes part of a complete exam answer.

Example 1: Using a Diagram

Question 1

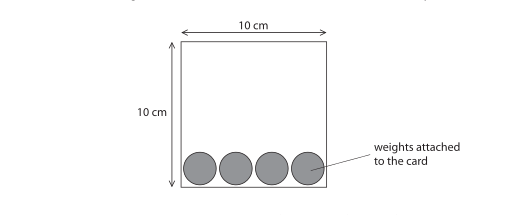
A student investigates the motion of a 10 cm square piece of card as it falls.
He attaches some weights to the bottom of the card to make sure it falls vertically. Diagram of a 10 cm by 10 cm square card with several circular weights attached along the bottom edge to make it fall vertically.
8
*P48444A0832*
9
*P48444A0932* Turn over
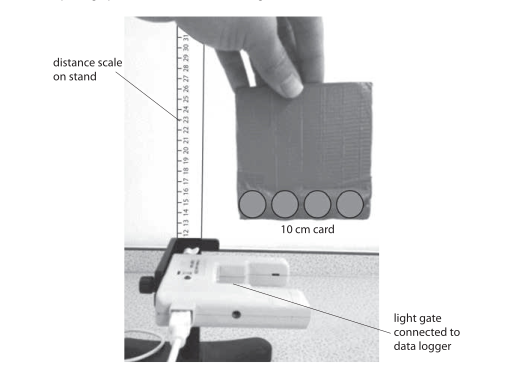
The photograph shows the student releasing a card. Photograph of an experimental setup: a 10 cm square card with weights along the bottom is held near a vertical distance scale on a stand, above a light gate connected to a data logger. Give two ways that the student could improve the accuracy of his measurements.
1
2

Final answer

  • Move the distance scale closer to the card, nearer to the light gate.
  • Measure the height at eye level to avoid parallax error.

Mark scheme points

  1. M1 One valid improvement, such as moving the scale closer to the card or using a ruler nearer the light gate.
  2. M2 A second valid improvement, such as measuring the height at eye level to avoid parallax.

Explanation

Placing the scale closer to the card makes it easier to read the card’s position accurately. Reading the scale at eye level prevents the reading being shifted by parallax.

Other acceptable improvements include:

  • using a clamp or other consistent release mechanism;
  • making sure the scale is vertical, using a set square if needed;
  • checking for and allowing for zero error.

Common mistakes

  • Writing only “reduce human error” without stating how the apparatus or method is improved.
  • Writing only “repeat the experiment”; repeats alone were not credited for this question.
  • Writing only “use a more precise instrument” without naming a specific improvement.
  • Giving two versions of the same improvement instead of two distinct methods.

Example 2: Using a Diagram

Question 2

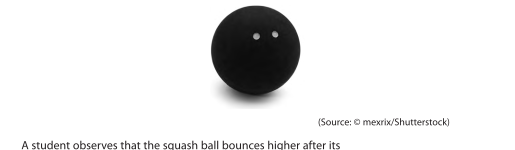
A squash ball is made of rubber and used to play a game called squash.
Photograph of a black squash ball.
A student observes that the squash ball bounces higher after its temperature increases.
The student designs an investigation to see how the temperature of the ball affects the maximum height after it bounces.
The diagram shows the ball at its maximum height after it bounces.
Diagram showing a circle representing a squash ball above a horizontal line representing the floor. The ball is shown at its maximum height after bouncing; the required distance is the vertical distance from the floor to the ball. Scale note: 1 cm on diagram = 4 cm in laboratory.
Determine the distance the ball moves from the floor to its maximum height.
Assume the ball does not change shape when it bounces.
[1cm on diagram = 4cm in laboratory]
distance = cm

Final answer

distance = 24.8 cm

Mark scheme points

  1. M1 Measure the distance vertically from the floor to the bottom of the ball: approximately 6.2 cm on the diagram.
  2. M2 Use the scale 1 cm on the diagram = 4 cm in the laboratory.

Explanation

Because the ball does not change shape, measure from the floor to the bottom of the ball. The diagram distance is about 6.2 cm. Convert this using the scale:

distance = 6.2 × 4
         = 24.8 cm

Therefore, the ball moves 24.8 cm from the floor to its maximum height.

Common mistakes

  • Measuring to the centre or top of the ball instead of to its bottom.
  • Giving 6.2 cm as the final answer without applying the scale factor of 4.
  • Forgetting to include the unit cm.
  • Examiners reported that most candidates remembered measuring bounce height with a ruler or equivalent; to secure both marks, make sure the measurement is from the floor to the bottom of the ball and then apply the scale.

Practise Movement and position questions

Build a focused practice set from this part of the Edexcel IGCSE Physics syllabus.