Edexcel IGCSE Biology revision

Feeding relationships questions

Interpret food chains and food webs, identify trophic levels and draw pyramids that represent the data.

Edexcel IGCSE Biology Subtopic 4.b

Feeding relationships syllabus

Questions on feeding relationships can test recall, calculations, explanations, diagrams, data handling and practical skills. You should be able to:

  • 4.6 understand the names given to different trophic levels, including producers, primary, secondary and tertiary consumers and decomposers
  • 4.7 understand the concepts of food chains, food webs, pyramids of number, pyramids of biomass and pyramids of energy transfer
  • 4.8 understand the transfer of substances and energy along a food chain
  • 4.9 understand why only about 10% of energy is transferred from one trophic level to the next

How to answer feeding relationships questions

  1. Identify the population, community or environmental factor before interpreting the ecological relationship.
  2. Quote values from graphs or tables and distinguish correlation from a supported causal explanation.
  3. For sampling methods, describe placement, repeats, measurements and how the result is made representative.
  4. Trace energy or matter through each trophic level or cycle without implying that energy is recycled.

Feeding relationships example questions and worked answers

These examples show how information in a diagram, graph or experimental context becomes part of a complete exam answer.

Example 1: Drawing a pyramid of numbers to scale

Adapted from January 2023 (R), Paper 1B · Question 3(b)(i)

Question 1

This is a food chain from a woodland ecosystem.

Oak treeMouseFox

A student counted 20 mice living around 4 oak trees. There were also 2 foxes in the area.

Draw a labelled pyramid of numbers for this food chain.

Your pyramid should be drawn to scale.

Final answer

Draw three equal-height, centred bars stacked as a pyramid: oak trees (4) at the bottom, mice (20) in the middle and foxes (2) at the top. Make the bar widths proportional to 4:20:2. For example, using 1 small grid square for every 2 organisms, the widths are 2, 10 and 1 squares respectively.

Foxes (2)Mice (20)Oak trees (4)Bar width represents the number of organisms

Mark scheme points

  1. M1 The bars form a pyramid: narrow at the base, wider in the middle and narrow at the top.
  2. M2 The bars are labelled oak trees, mice and foxes in the correct order.
  3. M3 The bar widths are drawn to scale for the numbers 4:20:2; the bar heights are the same.

Explanation

Put the oak trees at the bottom, mice above them and foxes at the top, following the food chain. The counts make the middle bar widest, while both the base and top bars are narrower. Keep the bars the same height and show the counts through their widths: 4:20:2. The example scale gives widths of 2, 10 and 1 grid squares.

Common mistakes

  • The examiner report notes that a few candidates left bars unlabelled, did not draw them to scale, or drew a bar chart instead of a pyramid. Check the labels, relative widths and pyramid shape.
  • Do not use different bar heights to represent the counts: keep the heights equal and vary the widths.
Example 2: Naming organisms and trophic levels

Adapted from June 2011, Paper 1B · Question 4(a)(i)

Question 2

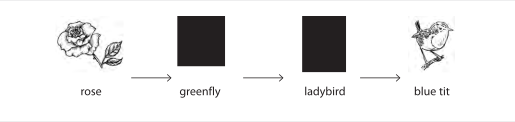
Here is a food chain.

Food chain showing rose, greenfly, ladybird and blue tit connected by arrows.

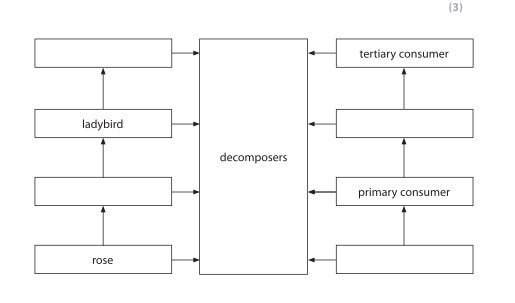
Use the information in this food chain to complete the diagram.

An incomplete diagram with decomposers, tertiary consumer, ladybird, primary consumer and rose labelled, with blank boxes connected by arrows.

Final answer

Put greenfly in the box between rose and ladybird, and blue tit in the box above ladybird. Put secondary consumer in the box between primary consumer and tertiary consumer, and producer in the bottom box.

Mark scheme points

  1. M1 Greenfly and blue tit are placed in the correct order: greenfly between rose and ladybird, and blue tit above ladybird.
  2. M2 Secondary consumer is placed between primary consumer and tertiary consumer.
  3. M3 Producer is placed in the bottom box, below primary consumer.

Explanation

The food chain is rose → greenfly → ladybird → blue tit. The greenfly feeds on the rose, and the ladybird feeds on the greenfly, so the greenfly belongs between them in the diagram. The blue tit comes after the ladybird.

The rose is a producer. The greenfly is a primary consumer, the ladybird is a secondary consumer, and the blue tit is a tertiary consumer. This places secondary consumer between the primary and tertiary consumers.

Common mistakes

  • Do not swap greenfly and blue tit: greenfly goes between rose and ladybird, while blue tit goes above ladybird.
  • Do not label the rose as a consumer; it is the producer at the bottom of the chain.

Practise Feeding relationships questions

Build a focused practice set from this part of the Edexcel IGCSE Biology syllabus.