Edexcel IGCSE Biology revision

Organisms in the environment questions

Investigate habitats, measure environmental factors and explain changes in populations using ecological evidence.

Edexcel IGCSE Biology Subtopic 4.a

The organism in the environment syllabus

Questions on the organism in the environment can test recall, calculations, explanations, diagrams, data handling and practical skills. You should be able to:

  • 4.1 understand the terms population, community, habitat and ecosystem
  • 4.2 practical: investigate the population size of an organism in two different areas using quadrats 4.3B understand the term biodiversity 4.4B practical: investigate the distribution of organisms in their habitats and measure biodiversity using quadrats
  • 4.5 understand how abiotic and biotic factors affect the population size and distribution of organisms

How to answer the organism in the environment questions

  1. Identify the population, community or environmental factor before interpreting the ecological relationship.
  2. Quote values from graphs or tables and distinguish correlation from a supported causal explanation.
  3. For sampling methods, describe placement, repeats, measurements and how the result is made representative.
  4. Trace energy or matter through each trophic level or cycle without implying that energy is recycled.

The organism in the environment example questions and worked answers

These examples show how information in a diagram, graph or experimental context becomes part of a complete exam answer.

Example 1: Choosing a precise timing instrument

Adapted from June 2013, Paper 2B · Question 3(a)(v)

Question 1

A student investigates how quickly water drains through soil. The photographs show two stop clocks, A and B, that could be used to measure the time.
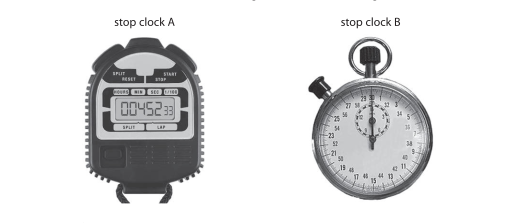
Stop clocks A and B side by side: A has a digital display reading to hundredths of a second and B has an analogue dial.

Which of these two stop clocks would give a more precise reading? Explain your answer.

Final answer

Stop clock A, because it displays time to more decimal places (hundredths), giving it a smaller scale interval and a more precise reading.

Mark scheme points

  1. M1 Identify clock A and explain that it shows more decimal places, hundredths, or has a smaller scale interval.

Explanation

A smaller scale interval means the clock can show finer differences in time. Clock A gives readings to hundredths, so it provides a more precise reading than clock B.

Common mistakes

  • Do not give only “it is digital”: identify clock A and explain that its display has a smaller interval or shows hundredths.

Example 2: Explaining a decline in squirrel numbers

Adapted from January 2020, Paper 1B · Question 3(c)

Question 2

Squirrels are animals that live in woodland. They feed on nuts produced by the trees.

The diagram shows a squirrel eating a nut.

Diagram of a squirrel eating a nut.

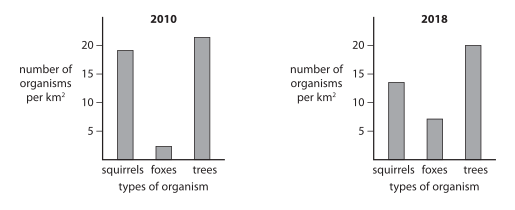
The graphs show the number of squirrels, foxes and trees in a woodland in 2010 and in 2018.

Two bar charts labelled 2010 and 2018, showing numbers of squirrels, foxes and trees per km².

Discuss possible reasons why there is a decrease in the number of squirrels from 2010 to 2018.

Use information from the graphs and your own knowledge in your answer.

Final answer

The graphs show that fox numbers increased and tree numbers decreased between 2010 and 2018. More foxes may have eaten more squirrels, increasing predation. Foxes may also have eaten some of the nuts, leaving less food for squirrels. With fewer trees producing nuts, the squirrels had a smaller food supply. Disease may have killed some squirrels, and some squirrels may have migrated out of the woodland.

Mark scheme points

Five of the following points are needed for full marks:

  1. M1 The graph shows more foxes; increased predation means more squirrels may be eaten.
  2. M2 Foxes may eat nuts, leaving less food for squirrels.
  3. M3 The graph shows fewer trees, which can mean fewer nuts are available.
  4. M4 Disease or infection may reduce the squirrel population.
  5. M5 Squirrels may migrate out of the woodland, reducing the number counted there.

Explanation

Use the graphs to identify the increase in foxes and decrease in trees, then explain how each could affect squirrels. More foxes can increase predation. Foxes eating nuts and fewer nut-producing trees can both reduce the squirrels’ food supply. Disease can reduce their numbers, while migration out of the woodland reduces the local population being counted.

Common mistakes

  • The examiner report notes that many candidates linked the squirrel decline to more foxes and fewer trees, but relatively few gained full marks. Include additional distinct possibilities, such as disease or migration, and explain how they could lower the squirrel population.
  • Do not just list “more foxes” or “fewer trees”: explain the effect, such as more squirrels being eaten or fewer nuts being available.

Practise The organism in the environment questions

Build a focused practice set from this part of the Edexcel IGCSE Biology syllabus.