Edexcel IGCSE Biology revision

Food production questions

Apply biology to crop yields, fermentation and fish farming, balancing productivity with environmental effects.

Edexcel IGCSE Biology Subtopic 5.a

Food production syllabus

Questions on food production can test recall, calculations, explanations, diagrams, data handling and practical skills. You should be able to:

  • 5.1 describe how glasshouses and polythene tunnels can be used to increase the yield of certain crops
  • 5.2 understand the effects on crop yield of increased carbon dioxide and increased temperature in glasshouses
  • 5.3 understand how the use of fertiliser can increase crop yield
  • 5.4 understand the reasons for pest control and the advantages and disadvantages of using pesticides and biological control with crop plants Micro-organisms
  • 5.5 understand the role of yeast in the production of food including bread
  • 5.6 practical: investigate the role of anaerobic respiration by yeast in different conditions
  • 5.7 understand the role of bacteria (Lactobacillus) in the production of yoghurt
  • 5.8 understand the use of an industrial fermenter and explain the need to provide suitable conditions in the fermenter, including aseptic precautions, nutrients, optimum temperature and pH, oxygenation and agitation, for the growth of micro-organisms Fish farming 5.9B understand the methods used to farm large numbers of fish to provide a source of protein, including maintaining water quality, controlling intraspecific and interspecific predation, controlling disease, removing waste products, controlling the quality and frequency of feeding, and selective breeding

How to answer food production questions

  1. Describe each stage of the biological technique in order and name the cells, enzymes or vectors involved.
  2. Distinguish selective breeding, genetic engineering and cloning before comparing their outcomes.
  3. Balance a stated benefit against a specific biological, environmental or ethical limitation.
  4. Use evidence from the question when evaluating yield, disease resistance, biodiversity or food security.

Food production example questions and worked answers

These examples show how information in a diagram, graph or experimental context becomes part of a complete exam answer.

Example 1: Plotting yeast respiration at different temperatures

Adapted from January 2018, Paper 1B · Question 5(c)(i)

Question 1

A student uses this apparatus to investigate the effect of temperature on anaerobic respiration in yeast.
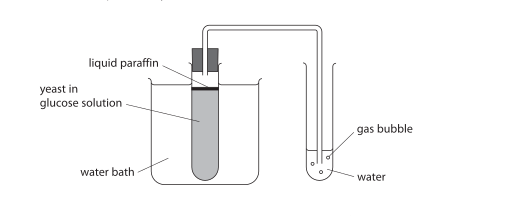
Apparatus with yeast in glucose solution in a water bath, covered with liquid paraffin, connected to a tube leading into water where gas bubbles are shown.

The student uses the water bath to control the temperature of the yeast in glucose solution.

He measures the rate of anaerobic respiration by counting the number of gas bubbles produced in one minute.

The table shows the student’s results.

Temperature of
water bath in °C
Rate of anaerobic respiration
in bubbles per minute
203
255
307
3610
4014
4520
523

Plot a graph to show the effect of temperature on the rate of anaerobic respiration.

Use a ruler to join the points with straight lines.

Final answer

Put temperature of the water bath (°C) on the horizontal axis and rate of anaerobic respiration (bubbles per minute) on the vertical axis. Use linear scales that use at least half of the graph grid. Plot the points (20, 3), (25, 5), (30, 7), (36, 10), (40, 14), (45, 20) and (52, 3), then use a ruler to join consecutive points with straight lines. Do not extend the line beyond the first or last point.

2025303540455055Temperature (°C)Respiration rate (bubbles min⁻¹) 0510152025

Mark scheme points

  1. M1 Use a linear scale that covers at least half of the graph grid.
  2. M2 Draw a neat line with straight sections through the plotted points; extrapolation loses one plotting mark.
  3. M3 Put temperature on the horizontal axis and rate on the vertical axis.
  4. M4 Label the axes with °C and bubbles per minute.
  5. M5 Plot all the data points correctly.

Explanation

Temperature is the variable being changed, so it goes on the horizontal axis. The measured rate goes on the vertical axis. A linear scale has equal intervals throughout, and using at least half the grid makes the points easier to plot accurately.

Plot each pair in the order (temperature, rate). The rate rises to 20 bubbles per minute at 45°C, then falls to 3 bubbles per minute at 52°C, so include that final low point. Join each neighbouring pair with straight lines as instructed.

Common mistakes

  • Swapping the axes or leaving out the units can lose the axis marks.
  • Missing the point at 52°C, or extending the line beyond the first or last point, can lose a plotting mark.
Example 2: Explaining the benefits of integrated aquaculture

Adapted from January 2022, Paper 2B · Question 4(c)

Question 2

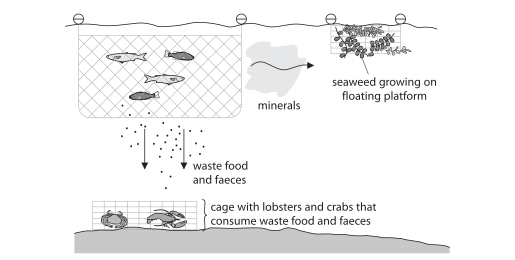
Multi‑trophic level aquaculture is a method of fish farming that has been developed to reduce environmental pollution and increase profits.

The diagram shows a multi‑trophic level aquaculture system.

A multi-trophic level aquaculture system showing a fish cage, waste food and faeces directed to a cage with lobsters and crabs that consume them, and minerals directed to seaweed growing on a floating platform.

Explain how the multi‑trophic level aquaculture system reduces environmental pollution, and increases the profits of fish farming.

Use information from the diagram and your own knowledge to support your answer.

Final answer

Lobsters and crabs eat waste food and faeces, so less waste is left to decompose and fewer decomposer bacteria respire, leaving more oxygen in the water. Seaweed takes up mineral nutrients such as nitrates, reducing algal growth and eutrophication. The farm can sell additional products, including lobsters, crabs and seaweed, and does not need to buy food for the lobsters and crabs, increasing profits.

Mark scheme points

Any five of the following points are needed; the alternatives are not all compulsory.

  1. M1 Lobsters and crabs eat or remove waste food and faeces.
  2. M2 Less waste decomposes, or there are fewer decomposers or bacteria.
  3. M3 There is less respiration by bacteria or decomposers.
  4. M4 More oxygen remains in the water because less is used in respiration; seaweed releasing oxygen is also acceptable.
  5. M5 Seaweed removes nitrates, minerals or other nutrients from the water.
  6. M6 Removing nutrients reduces algal growth, algal blooms or eutrophication.
  7. M7 There are more products to sell, such as lobsters, crabs or seaweed.
  8. M8 There is no need to buy food for the lobsters or crabs.
  9. M9 There is no need to buy minerals for the seaweed.

Explanation

The crabs and lobsters use waste from the fish cage as food, so less organic waste remains in the water. With less waste to break down, there is less decomposition and less respiration by decomposer bacteria. This means less oxygen is used, so more oxygen remains in the water.

Seaweed takes up dissolved minerals and nutrients. With fewer nutrients available, less algae can grow, reducing the risk of an algal bloom and eutrophication. The system can also increase profit by providing extra products to sell and making use of waste as food for the crabs and lobsters rather than buying their food.

Common mistakes

  • Some candidates gave too little detail: the examiner report notes that answers could miss reduced algal growth, reduced bacterial respiration and increased oxygen. Spell out these steps rather than only saying that pollution is reduced.
  • Do not describe seaweed as simply “cleaning the water”; state that it takes up mineral nutrients, which reduces algal growth or eutrophication.

Practise Food production questions

Build a focused practice set from this part of the Edexcel IGCSE Biology syllabus.