Example 1: Comparing egg production as chickens age
Adapted from January 2017, Paper 1B · Question 2(b)
Question 1
The photograph shows a chicken with feathers.

Selective breeding is also used to breed chickens for egg production and chickens for meat production.
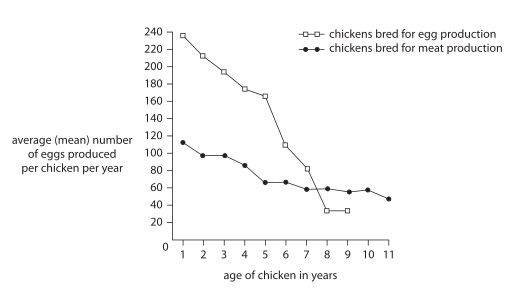
The graph shows how age affects the average (mean) number of eggs produced per chicken per year.
The graph shows this information for chickens bred for egg production and for chickens bred for meat production.
Describe how age affects the number of eggs produced by each group of chickens.
Final answer
As chickens get older, the mean number of eggs produced per chicken per year decreases in both groups. It decreases faster in chickens bred for egg production.
Mark scheme points
- M1 Egg production decreases as chickens get older.
- M2 The decrease is faster or greater in chickens bred for egg production.
Explanation
Describe the overall trend in both groups first: egg production falls with age. Then compare the lines: the fall is steeper for chickens bred for egg production, so their egg production decreases faster.
Common mistakes
- Saying only that egg production decreases misses the comparison needed for the second mark.