Example 1: Using a Diagram
Question 1
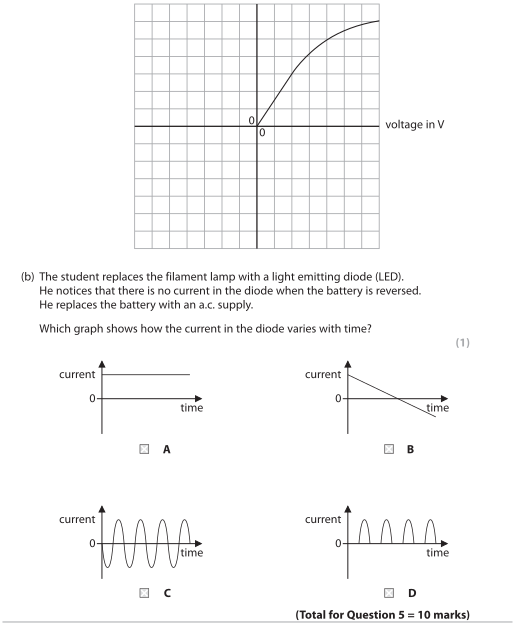
The student replaces the filament lamp with a light emitting diode (LED).
He notices that there is no current in the diode when the battery is reversed.
He replaces the battery with an a.c. supply.
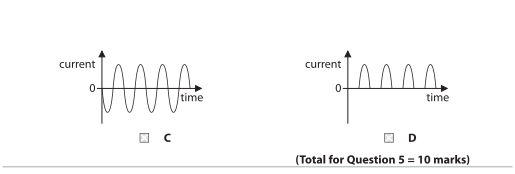
Which graph shows how the current in the diode varies with time?
He notices that there is no current in the diode when the battery is reversed.
He replaces the battery with an a.c. supply.
Which graph shows how the current in the diode varies with time?
A
B
C
D
Final answer
D — a half-wave rectified current.
Mark scheme points
- M1 Selects D: current consists of repeated positive pulses, with zero current during the opposite half-cycles.
Explanation
An LED conducts current in only one direction. During one half-cycle of the a.c. supply it is forward-biased and current flows. During the opposite half-cycle it is reverse-biased, so the current is zero. Therefore the graph has positive pulses separated by intervals along the zero-current line, as shown by D.
Common mistakes
- Choosing a sinusoidal graph with negative current: an LED does not allow current in the reverse direction.
- Drawing a continuous positive current: the LED conducts only during one half of each a.c. cycle.
- Forgetting the zero-current intervals between the positive pulses.