Example 1: Reading an Experimental Diagram
Question 1
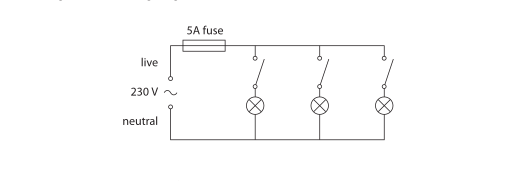
The diagram shows the lighting circuit in an office.
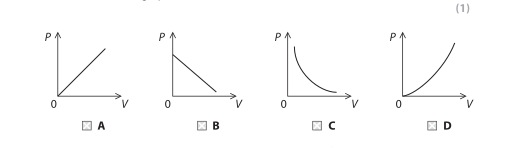
The graphs show some ways that power (P) can vary with voltage (V).
Which is the correct graph for a fixed resistor?
Final answer
D
Mark scheme points
- M1 Selects graph D.
Explanation
For a fixed resistor, the resistance R is constant. Using Ohm’s law, I = V/R:
P = I × V
P = (V/R) × V
P = V²/R
Therefore, power is proportional to the square of the voltage. The graph starts at the origin and curves upwards, becoming steeper as voltage increases. This is graph D.
Common mistakes
- Choosing a straight-line graph because the formula P = IV is remembered without considering that current also changes with voltage.
- Forgetting that a fixed resistor has constant resistance, so I = V/R.
- Selecting a graph that decreases as voltage increases; power increases when the voltage increases.