Edexcel IGCSE Physics revision

Edexcel IGCSE Physics Cosmology questions

Revise the syllabus content for Cosmology, learn how to approach common exam questions, and study two worked examples with clear diagrams.

Edexcel IGCSE Physics Subtopic 8.d

Cosmology syllabus

Questions on cosmology can test recall, calculations, explanations, diagrams, data handling and practical skills. You should be able to:

  • 8.13P describe the past evolution of the universe and the main arguments in favour of the Big Bang theory
  • 8.14P describe evidence that supports the Big Bang theory (red-shift and cosmic microwave background - CMB - radiation)
  • 8.15P describe that if a wave source is moving relative to an observer, there will be a change in the observed frequency and wavelength
  • 8.16P use the equation relating to change in wavelength, reference wavelength, velocity of a galaxy and the speed of light: change in wavelength / reference wavelength = velocity of a galaxy / speed of light (λ − λ₀) / λ₀ = Δλ / λ₀ = v / c
  • 8.17P describe the red-shift in light received from galaxies at different distances away from the Earth
  • 8.18P explain why the red-shift of galaxies provides evidence for the expansion of the universe

How to answer cosmology questions

  1. Identify the scale and object involved before choosing a gravitational or orbital relationship.
  2. Keep the life cycles of Sun-like and high-mass stars separate and in the correct order.
  3. Use observations such as red-shift or background radiation as evidence, then state the conclusion.
  4. Show conversions for orbital radius, period and speed before calculating.

Cosmology example questions and worked answers

These examples show how information in a diagram, graph or experimental context becomes part of a complete exam answer.

Example 1: Using a Diagram

Question 1

This question is about astrophysics.

An astronomer observes the light from a nearby galaxy.

She notices that the spectra for hydrogen from the right side and left side of the galaxy are different.

She compares them to the spectrum for hydrogen from the centre of the galaxy.
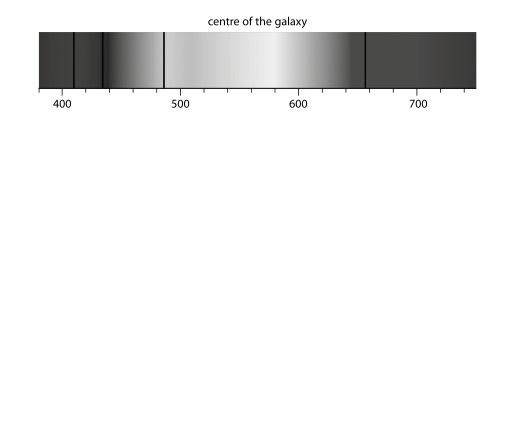
Three hydrogen spectra with wavelength scales (about 400 to 700 nm): one from the left side of a galaxy, one from the right side, and one from the centre. The spectral lines on the left and right are shifted relative to the centre spectrum, showing different Doppler shifts.

Explain what information the two spectra give about the movement of the galaxy.

Final answer

The spectrum from the right-hand side shows a red shift, so this side of the galaxy is moving away from the astronomer. The spectrum from the left-hand side shows a blue shift, so this side is moving towards the astronomer. Therefore, the galaxy is spinning.

Mark scheme points

  1. M1 The right-hand spectrum shows a red shift.
  2. M2 The left-hand spectrum shows a blue shift.
  3. M3 The galaxy is spinning.

Explanation

Compare the hydrogen lines from each side with the lines from the centre:

  • A shift towards longer wavelengths is a red shift. The right-hand side is therefore moving away from the astronomer.
  • A shift towards shorter wavelengths is a blue shift. The left-hand side is therefore moving towards the astronomer.
  • Opposite sides moving in opposite directions shows that the galaxy is rotating or spinning.

Common mistakes

  • Do not reverse the meanings: red shift means moving away, while blue shift means moving towards the observer.
  • State which side produces each shift; saying only that the spectra are different is not enough.
  • The conclusion is that the galaxy is spinning, not that the entire galaxy is simply moving in one direction.
Example 2: Using a Diagram

Question 2

*P73429A02428*
This question is about red-shift.
*P73429A02528*
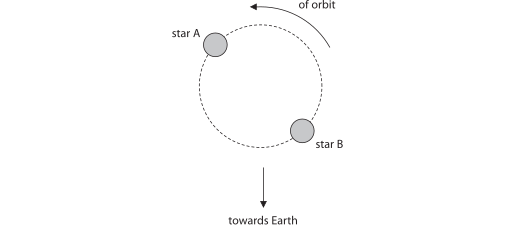
The diagram shows two identical stars, A and B, orbiting each other.
Light from each star arrives at Earth.
As the stars move in their orbit, the wavelength of the light observed at Earth changes due to the Doppler effect.
Add an X to the diagram to show the position of star B when the light emitted from it shows maximum red-shift when detected on Earth.
Orbit diagram: two identical stars A and B shown on a circular dashed orbit. An arrow indicates the direction of orbit along the top of the circle. An arrow labelled 'towards Earth' points downward from below the orbit. Star A is shown on the upper-left side of the orbit and star B on the lower-right side.

Final answer

Place X at the 3 o’clock position on the orbit:

star A star B direction of orbit towards Earth X

Mark scheme points

  1. M1 X is at the 3 o’clock position on the orbit, by eye; an indicative mark within one star’s radius of this position is acceptable.

Explanation

Maximum red-shift occurs when star B has its greatest velocity component directly away from Earth. With the direction of orbit shown, this happens when star B is at the right-hand side of the orbit, directly to the right of its centre.

  • Draw X at the 3 o’clock position on the circular orbit.

Common mistakes

  • Examiners reported that very few candidates linked maximum red-shift with the highest recessional speed. Focus on the star’s velocity away from Earth, not simply its position in the orbit.
  • Do not put X at star B’s position in the original diagram; star B must move to the right-hand side of the orbit.
  • Do not choose the point furthest from Earth just because it is furthest away; red-shift depends on the velocity component away from Earth.

Practise Cosmology questions

Build a focused practice set from this part of the Edexcel IGCSE Physics syllabus.