Example 1: Working With Graphs
Question 1
The table gives data for some of the planets in the solar system.
| Planet | Gravitational field strength at surface in N/kg | Orbital radius in km | Orbital speed in km/ s |
|---|---|---|---|
| Mercury | 3.7 | 57.9 × 10⁶ | 47.4 |
| Venus | 8.9 | 108.2 × 10⁶ | 35.0 |
| Jupiter | 23.1 | 778.6 × 10⁶ | 13.1 |
| Saturn | 9.0 | 1433.5 × 106 | 9.7 |
| Uranus | 8.7 | 2872.5 × 106 | 6.8 |
| Neptune | 12.7 | 4495.1 × 106 | 5.4 |
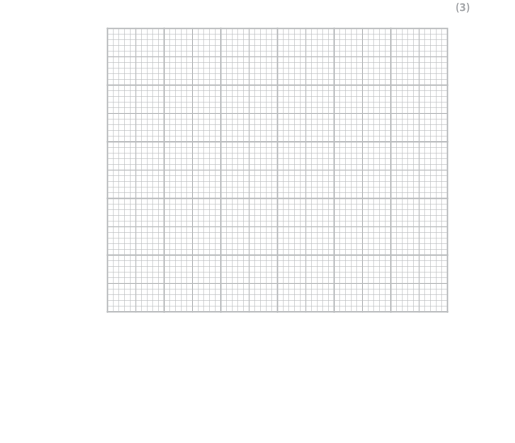
Plot a bar chart of the gravitational field strength for each planet.
Final answer
One correct bar chart is:
Mark scheme points
- M1 Use a suitable linear scale, with more than 50% of the available grid used.
- M2 Label the axes with the quantities and the unit: gravitational field strength at the surface in N/kg, and planet.
- M3 Plot all six bar heights correctly to the nearest half square.
Explanation
- A linear vertical scale from 0 to 25 N/kg is suitable and uses most of the plotting area.
- The horizontal axis identifies each planet, while the vertical axis gives gravitational field strength and its unit, N/kg.
- Draw one bar for each planet with heights: Mercury 3.7, Venus 8.9, Jupiter 23.1, Saturn 9.0, Uranus 8.7 and Neptune 12.7 N/kg.
Common mistakes
- Do not use a non-linear scale; equal distances on the axis must represent equal changes in gravitational field strength.
- Do not choose intervals of 3, because this makes accurate plotting and reading difficult and is specifically rejected.
- Include the y-axis quantity and unit, not just the numerical scale.
- Draw bars rather than joining the data points with a line graph.
- Examiners reported that most candidates plotted the chart well and scored all 3 marks; the common losses were an omitted y-axis label or unit and an inappropriate scale.