Edexcel IGCSE Physics revision

Edexcel IGCSE Physics Stellar evolution questions

Revise the syllabus content for Stellar evolution, learn how to approach common exam questions, and study two worked examples with clear diagrams.

Edexcel IGCSE Physics Subtopic 8.c

Stellar evolution syllabus

Questions on stellar evolution can test recall, calculations, explanations, diagrams, data handling and practical skills. You should be able to:

  • 8.7 understand how stars can be classified according to their colour
  • 8.8 know that a star’s colour is related to its surface temperature
  • 8.9 describe the evolution of stars of similar mass to the Sun through the following stages: nebula star (main sequence) red giant white dwarf
  • 8.10 describe the evolution of stars with a mass larger than the Sun
  • 8.11P understand how the brightness of a star at a standard distance can be represented using absolute magnitude
  • 8.12P draw the main components of the Hertzsprung–Russell diagram (HR diagram)

How to answer stellar evolution questions

  1. Identify the scale and object involved before choosing a gravitational or orbital relationship.
  2. Keep the life cycles of Sun-like and high-mass stars separate and in the correct order.
  3. Use observations such as red-shift or background radiation as evidence, then state the conclusion.
  4. Show conversions for orbital radius, period and speed before calculating.

Stellar evolution example questions and worked answers

These examples show how information in a diagram, graph or experimental context becomes part of a complete exam answer.

Example 1: Using a Diagram

Question 1

Diagram 1 shows a planet orbiting a star, and a moon orbiting a planet.
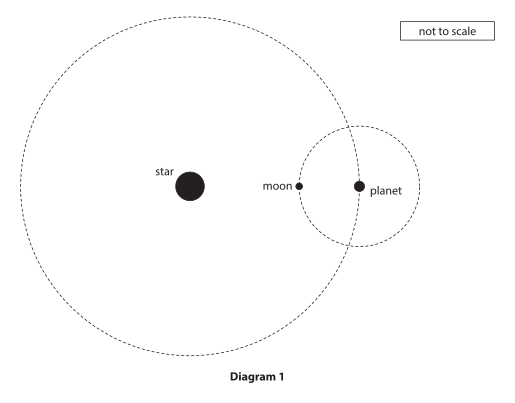
Diagram 1: A star with a planet shown on a large circular orbit around it, and a moon shown on a smaller circular orbit around the planet; not to scale.

Diagram 2 shows the region around the Sun, a yellow star, where liquid water can exist on the surface of planets. This is because the surface temperature of the planet is between 0°C and 100°C.

Diagram 2: The Sun at the centre with a ring-shaped ‘liquid water region’ around it; Earth is shown within the ring.

Explain what would happen to the position of the liquid water region if the Sun was replaced with a blue star of the same size.

Final answer

The blue star is hotter than the Sun, so the liquid water region would be further away from the star, with a larger radius.

Mark scheme points

  1. M1 The blue star is hotter than the Sun.
  2. M2 The liquid water region is further away from the star, or has a larger radius.

Explanation

A blue star has a higher surface temperature than a yellow star such as the Sun. Therefore, planets at the same distance would receive more heating and would be too hot for liquid water. The region where the surface temperature is between 0°C and 100°C must therefore be located further from the star.

Common mistakes

  • State both that the blue star is hotter and that the region moves further away.
  • Do not just say that the liquid water becomes a gas; the question asks about the position of the region.
  • Do not place the region closer to the hotter star.
  • Examiners reported that most candidates recognised that the blue star would be hotter, but only the most able candidates correctly linked this to the region moving further away.
Example 2: Using a Diagram

Question 2

Table 1 shows the colour of some stars.
StarColour
Sunyellow
Rigelblue
Betelgeusered
Arcturusorange
Siriuswhite
Table 1
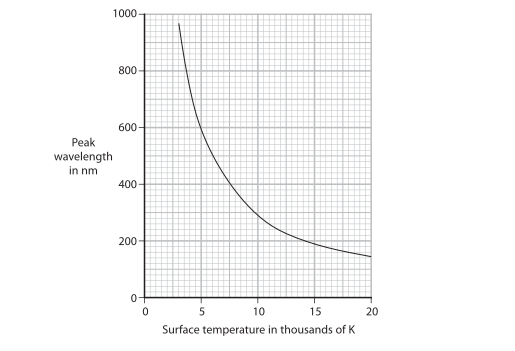
The graph shows the relationship between the peak wavelength of light emitted by a star and the surface temperature of the star. Graph of peak wavelength (nm) versus surface temperature (thousands of K) showing an inverse relationship (peak wavelength decreases as temperature increases). A scientist suggests that the two variables are linked by this formula.
peak wavelength×surface temperature = constant
Use data from the graph to justify this formula.


Final answer

Read two pairs of values from the graph:

At 10 kK:  peak wavelength = 280 nm
280 × 10 = 2800 nm kK

At 20 kK:  peak wavelength = 140 nm
140 × 20 = 2800 nm kK

The constants are the same, so the results agree with the proposed formula.

Mark scheme points

  1. M1 Read a valid pair of values from the graph.
  2. M2 Substitute the first pair into peak wavelength × surface temperature to calculate the constant.
  3. M3 Read a different pair of values and correctly calculate the constant again.
  4. M4 State that the constants are the same, so the results agree with the proposed relationship.

Explanation

The graph alone suggests an inverse relationship, but numerical evidence is needed. Choose two separated points that can be read clearly. For each point, multiply the peak wavelength by the surface temperature. Since both products are approximately 2800 nm kK, the value of the constant is unchanged. Therefore, the data support the formula.

  • Use two different pairs of readings, not just one.
  • Use multiplication, because the proposed relationship is wavelength × temperature = constant.
  • Compare the two calculated products explicitly.

Common mistakes

  • Describing the curve as “inverse” without using any numerical readings from the graph.
  • Using only one pair of values, so there is no second constant for comparison.
  • Dividing the wavelength by the temperature instead of multiplying them.
  • Examiners reported that a candidate who used no graph data scored no marks, whereas using two pairs of readings and comparing the constants earned full marks.

Practise Stellar evolution questions

Build a focused practice set from this part of the Edexcel IGCSE Physics syllabus.