Edexcel IGCSE Physics revision

Edexcel IGCSE Physics Light and sound questions

Revise the syllabus content for Light and sound, learn how to approach common exam questions, and study two worked examples with clear diagrams.

Edexcel IGCSE Physics Subtopic 3.d

Light and sound syllabus

Questions on light and sound can test recall, calculations, explanations, diagrams, data handling and practical skills. You should be able to:

  • 3.14 know that light waves are transverse waves and that they can be reflected and refracted
  • 3.15 use the law of reflection (the angle of incidence equals the angle of reflection)
  • 3.16 draw ray diagrams to illustrate reflection and refraction
  • 3.17 practical: investigate the refraction of light, using rectangular blocks, semi-circular blocks and triangular prisms
  • 3.18 know and use the relationship between refractive index, angle of incidence and angle of refraction: n = sin i / sin r
  • 3.19 practical: investigate the refractive index of glass, using a glass block
  • 3.20 describe the role of total internal reflection in transmitting information along optical fibres and in prisms
  • 3.21 explain the meaning of critical angle c
  • 3.22 know and use the relationship between critical angle and refractive index: sin c = 1 / n
  • 3.23 know that sound waves are longitudinal waves that can be reflected and refracted
  • 3.24P know that the frequency range for human hearing is 20–20 000 Hz
  • 3.25P practical: investigate the speed of sound in air
  • 3.26P understand how an oscilloscope and microphone can be used to display a sound wave
  • 3.27P practical: investigate the frequency of a sound wave using an oscilloscope
  • 3.28P understand how the pitch of a sound relates to the frequency of vibration of the source
  • 3.29P understand how the loudness of a sound relates to the amplitude of vibration of the source

How to answer light and sound questions

  1. Label wavelength, amplitude, frequency and normal lines before interpreting a diagram.
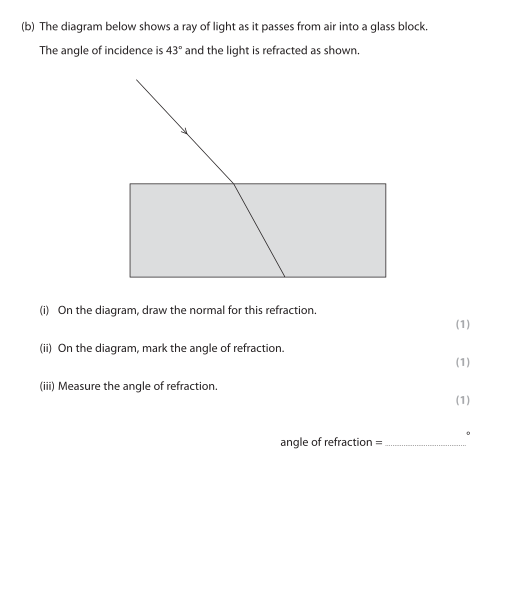
  2. Use a ruler for ray diagrams and measure angles from the normal, not the surface.
  3. Keep wave properties separate from applications and link each hazard to a suitable precaution.
  4. For calculations, convert frequencies and distances before using wave speed relationships.

Light and sound example questions and worked answers

These examples show how information in a diagram, graph or experimental context becomes part of a complete exam answer.

Example 1: Using a Diagram

Question 1

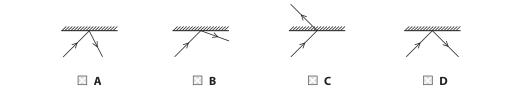
Which diagram shows the reflection of a ray of light at a plane mirror?
A Option A: small diagram of a plane mirror with an incident and reflected ray drawn.
B Option B: small diagram of a plane mirror with an incident and reflected ray drawn.
C Option C: small diagram of a plane mirror with an incident and reflected ray drawn.
D Option D: small diagram of a plane mirror with an incident and reflected ray drawn.

Final answer

D

D

Mark scheme points

  1. M1 Selects diagram D.

Explanation

At a plane mirror, the incident ray and reflected ray must obey the law of reflection: the angle of incidence equals the angle of reflection, measured from the normal to the mirror. Diagram D shows the ray approaching the mirror and leaving at the corresponding equal angle.

Common mistakes

  • Choosing a diagram where the ray bends along the mirror instead of reflecting away from it.
  • Comparing the angles with the mirror surface rather than checking that the angles to the normal are equal.
  • Forgetting that the reflected ray must travel away from the point where the incident ray meets the mirror.
Example 2: Using a Diagram

Question 2

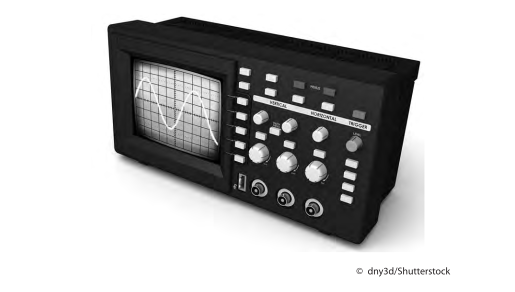
The photograph shows an oscilloscope.
Photograph of an oscilloscope with a screen showing a waveform and multiple control knobs.

An oscilloscope can be used to determine the frequency of a sound wave.

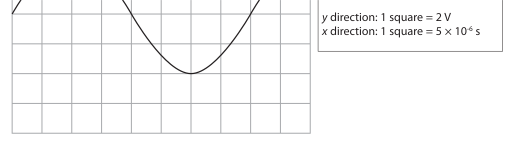
Diagram 1 shows an oscilloscope screen when a sound wave is detected.

It also shows the settings of the oscilloscope.

Oscilloscope settings
y direction: 1 square = 2 V
x direction: 1 square = 5 × 10⁻⁶ s
Diagram 1: oscilloscope trace showing a sinusoidal wave across the grid; the horizontal distance between successive peaks is about 8 squares.

Diagram 1

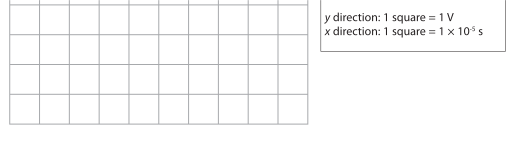
The oscilloscope settings are changed, as shown in Diagram 2.

Oscilloscope settings
y direction: 1 square = 1 V
x direction: 1 square = 1 × 10⁻⁵ s
Diagram 2: blank oscilloscope grid for drawing the wave using the new voltage and time-base settings.

Diagram 2

On Diagram 2, draw the wave that would be displayed on the oscilloscope screen if the same sound wave is detected using these new settings.

Final answer

Draw a wave with amplitude 4 squares and time period 4 squares:

Mark scheme points

  1. M1 The wave has an amplitude of 4 squares.
  2. M2 The wave has a time period of 4 squares.

Explanation

The same sound wave has the same physical voltage amplitude and the same time period. Only the oscilloscope scales have changed.

Original amplitude = 2 squares
New amplitude = 2 × (2 V per square) ÷ (1 V per square)
              = 4 squares

Original period = 8 squares
New period = 8 × (5 × 10⁻⁶ s) ÷ (1 × 10⁻⁵ s)
            = 4 squares

Therefore, measure the amplitude from the middle line to a peak: it must be 4 squares. The horizontal distance between successive peaks, or successive troughs, must be 4 squares.

Common mistakes

  • Do not use 8 squares for the period: the new time per square is twice as large.
  • Do not confuse amplitude with peak-to-peak height. An amplitude of 4 squares gives a peak-to-trough height of 8 squares.
  • Remember to rescale the vertical height as well as the horizontal spacing.
  • Examiners reported that most candidates changed the time period to four squares, but rather fewer remembered to scale the amplitude correctly.

Practise Light and sound questions

Build a focused practice set from this part of the Edexcel IGCSE Physics syllabus.