Edexcel IGCSE Physics revision

Edexcel IGCSE Physics The electromagnetic spectrum questions

Revise the syllabus content for The electromagnetic spectrum, learn how to approach common exam questions, and study two worked examples with clear diagrams.

Edexcel IGCSE Physics Subtopic 3.c

The electromagnetic spectrum syllabus

Questions on the electromagnetic spectrum can test recall, calculations, explanations, diagrams, data handling and practical skills. You should be able to:

  • 3.10 know that light is part of a continuous electromagnetic spectrum that includes radio, microwave, infrared, visible, ultraviolet, x-ray and gamma ray radiations, and that all these waves travel at the same speed in free space
  • 3.11 know the order of the electromagnetic spectrum in terms of decreasing wavelength and increasing frequency, including the colours of the visible spectrum
  • 3.12 explain some of the uses of electromagnetic radiations, including: radio waves: broadcasting and communications microwaves: cooking and satellite transmissions infrared: heaters and night vision equipment visible light: optical fibres and photography ultraviolet: fluorescent lamps x-rays: observing the internal structure of objects and materials, including for medical applications gamma rays: sterilising food and medical equipment
  • 3.13 explain the detrimental effects of excessive exposure of the human body to electromagnetic waves, including: microwaves: internal heating of body tissue infrared: skin burns ultraviolet: damage to surface cells and blindness gamma rays: cancer, mutation and describe simple protective measures against the risks

How to answer the electromagnetic spectrum questions

  1. Label wavelength, amplitude, frequency and normal lines before interpreting a diagram.
  2. Use a ruler for ray diagrams and measure angles from the normal, not the surface.
  3. Keep wave properties separate from applications and link each hazard to a suitable precaution.
  4. For calculations, convert frequencies and distances before using wave speed relationships.

The electromagnetic spectrum example questions and worked answers

These examples show how information in a diagram, graph or experimental context becomes part of a complete exam answer.

Example 1: Using a Diagram

Question 1

*P71896A02532* Turn over

25



9 This question is about waves.

*P71896A02632* 26



*P71896A02732* Turn over

27



A student uses a microwave source and a receiver to investigate microwaves.

Photograph 1 shows how the student sets up their apparatus.

Photograph 1
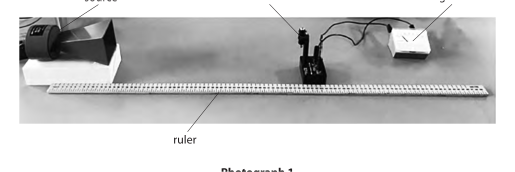
Photograph 1: A microwave source on the left and a receiver positioned along a ruler; the receiver is connected by wires to an analogue meter that displays detected microwave strength.

The meter shows the strength of the microwaves detected by the receiver.

The strength of the microwaves is measured in arbitrary units.

The student varies the distance between the microwave source and the receiver, and records the meter readings.

The graph shows the results of the student’s investigation.
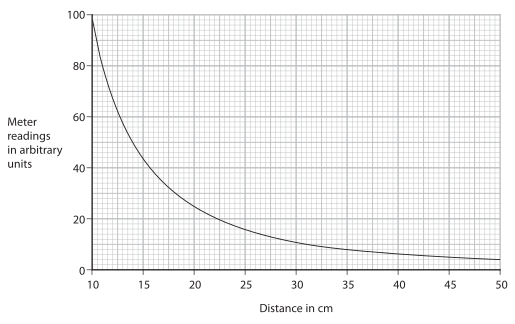
Graph of Meter readings in arbitrary units (0 to 100) against Distance in cm (10 to 50). A decreasing curve starts near 100 at 10 cm and falls steeply at first, then more gradually towards a small value by 50 cm.

The student concludes that the meter reading is inversely proportional to the distance between the microwave source and the receiver.

To be inversely proportional

meter reading × distance = constant

Comment on the student’s conclusion.

You should use data from the graph in your answer.

Final answer

The student’s conclusion is incorrect. The relationship is not inversely proportional.

At 10 cm: 100 × 10 = 1000
At 20 cm: 25 × 20 = 500

The products are different, so meter reading × distance is not constant.

Mark scheme points

  1. M1 State that the relationship is not inversely proportional, or that the student’s conclusion is incorrect.
  2. M2 Correctly calculate the product for one pair of graph readings, for example 100 × 10 = 1000.
  3. M3 Correctly calculate the product for a second pair of graph readings, for example 25 × 20 = 500.
  4. M4 State that meter reading × distance is not constant.

Explanation

For inverse proportionality, multiplying the meter reading by the distance must give the same value for every pair of readings. Read two clear points from the graph and compare their products:

R = 100, d = 10 cm:  R × d = 1000
R = 25,  d = 20 cm:  R × d = 500

Because 1000 and 500 are not equal, the product is not constant. Therefore, the meter reading is not inversely proportional to distance.

Common mistakes

  • Do not just state that the graph is curved or decreasing; this does not test inverse proportionality.
  • Use the graph values in the calculation rather than claiming that the relationship “looks inverse”.
  • Calculate meter reading × distance, not meter reading ÷ distance.
  • Give two products and compare them; one calculation alone cannot show whether the product is constant.
  • Nearly half of candidates did not use data from the graph, even though the question required it. Always show two products and state whether they are constant.

Example 2: Using a Diagram

Question 2

A space probe was launched in 2007.
Its mission was to visit Ceres, a distant dwarf planet in the asteroid belt. The space probe sends data back to Earth as a radio wave.
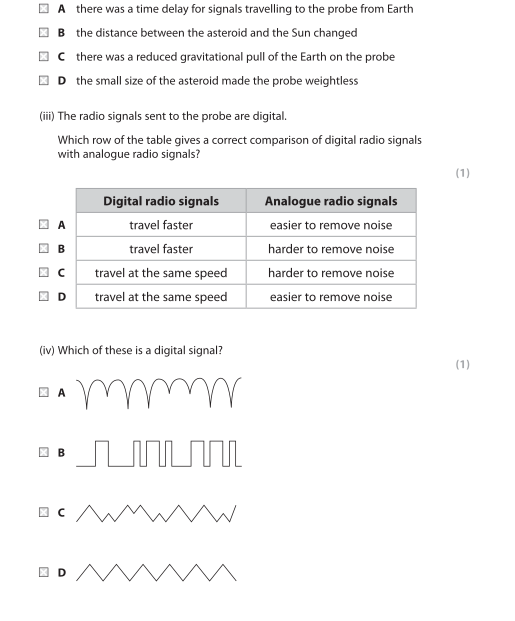
The sketch graph shows how the radio wave changes as the radio wave travels in free space towards the Earth. Image shows a space probe with solar panels, and below it a sketch graph of a sinusoidal radio wave against distance travelled in free space. The wave’s amplitude decreases with increasing distance travelled; wavelength appears unchanged. Which of these is a digital signal?
A
B
C
D
Four signal traces labelled A to D: A is a smooth continuous wavy analogue-like curve; B is a series of rectangular high/low pulses (digital); C is an irregular jagged analogue-like waveform; D is a regular zigzag triangular waveform (continuous analogue).

Final answer

B

Mark scheme points

  1. M1 Select B.

Explanation

A digital signal has only two possible signal levels, representing binary 0 and 1. Signal B consists of rectangular pulses switching between two levels, so it is digital.

Signals A, C and D have continuously varying amplitudes with more than two possible values, so they are analogue signals.

Common mistakes

  • Choosing a regular waveform automatically: regularity does not make a signal digital.
  • Confusing a triangular or smooth wave with a digital signal; these vary continuously through many amplitudes.
  • Looking for the largest amplitude instead of checking whether the signal has only two distinct levels.

Practise The electromagnetic spectrum questions

Build a focused practice set from this part of the Edexcel IGCSE Physics syllabus.