Example 1: Graphing the effect of temperature on lipase
Adapted from June 2023, Paper 1B · Question 7(d)
Question 1
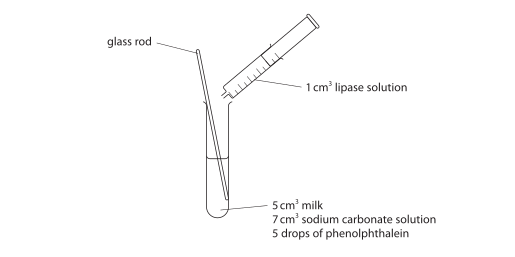
Lipase digests lipid into fatty acids and glycerol. The fatty acids change the pH of the solution.
A student adds lipase to milk, sodium carbonate solution and phenolphthalein indicator. The mixture is initially pink. She records the time until it loses its pink colour, repeating the test at six temperatures.
The table shows the student’s results.
| Temperature in °C |
Time taken for contents to lose the pink colour in seconds |
|---|---|
| 20 | 385 |
| 25 | 340 |
| 30 | 300 |
| 35 | 250 |
| 40 | 275 |
| 45 | 360 |
Plot a line graph to show the effect of temperature on the time taken for the contents of the test tube to lose the pink colour.
Use a ruler to join your points with straight lines.
Final answer
The line graph shows temperature against the time taken to lose the pink colour, with consecutive points joined by straight lines.
Mark scheme points
- M1 Use a linear scale, with the plotted data spanning at least 2.5 large squares vertically. The axes may start at zero or be truncated.
- M2 Join all consecutive points with straight lines. Do not extend the lines beyond the first or last point.
- M3 Put temperature on the horizontal x-axis and time on the vertical y-axis.
- M4 Label temperature in °C and time in seconds or s.
- M5 Plot all six points correctly, within half a small square: (20, 385), (25, 340), (30, 300), (35, 250), (40, 275) and (45, 360).
Explanation
Temperature is the variable the student changes, so it belongs on the x-axis. The time measured belongs on the y-axis. Use this checklist when drawing:
- Choose evenly spaced scales that use most of the grid. Here, the time axis starts at 200 s rather than zero, which is allowed.
- Use a ruler to connect neighbouring points, stopping at the two end points.
- Check that temperature is horizontal and time is vertical.
- Include both the quantity and its unit on each axis.
- Check each plotted value against the table. For example, 385 s lies between 375 s and 400 s, not on either grid line.
Common mistakes
- Most candidates gained 4 or 5 marks. Those missing full marks usually chose a scale that used too little of the grid or omitted axis units. Check the vertical spread and both units before finishing.
- Drawing a smooth curve, a bar chart or lines extending beyond the end points loses the straight-line joining mark. Join only the recorded points with a ruler.