Example 1: Plotting fish breathing rates
Adapted from January 2014, Paper 1B · Question 7(b)(i)
Question 1
Fish breathe by opening their mouths to allow water containing oxygen to pass over their gills. This is shown in the diagram.
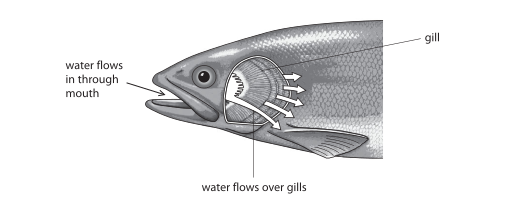
Students investigated the effect of temperature on the breathing rate of fish. They put fish of the same size in tanks of water at different temperatures. They measured the breathing rate by counting the number of times the fish opened their mouths in a minute.
The results are shown in the table.
| Water temp. (°C) |
Breathing rate in breaths per minute | ||||
|---|---|---|---|---|---|
| Trial 1 | Trial 2 | Trial 3 | Trial 4 | Mean | |
| 2 | 2 | 3 | 3 | 4 | 3 |
| 8 | 30 | 33 | 27 | 30 | 30 |
| 14 | 54 | 52 | 53 | 53 | 53 |
| 20 | 80 | 75 | 81 | 84 | 80 |
| 26 | 101 | 98 | 102 | 101 | 101 |
Plot a line graph to show the effect of water temperature on the average breathing rate of the fish. Join the points with straight lines.
Final answer
Use linear scales: water temperature from 0 to 30 °C on the horizontal axis and average breathing rate from 0 to 120 breaths per minute on the vertical axis. Label the axes Water temperature (°C) and Average breathing rate (breaths per minute). Plot (2, 3), (8, 30), (14, 53), (20, 80) and (26, 101), then join consecutive points with straight lines.
Mark scheme points
- M1 Use a linear scale.
- M2 Join the plotted points with straight lines.
- M3 Put water temperature on the horizontal axis and breathing rate on the vertical axis.
- M4 Label the axes with breathing rate per minute and temperature in °C.
- M5 Plot the five average values accurately: (2, 3), (8, 30), (14, 53), (20, 80) and (26, 101).
Explanation
Use the average breathing rates in the table, not the separate trial results. Put temperature on the horizontal axis and breathing rate on the vertical axis. A linear scale means equal steps on an axis represent equal changes in value. Plot each temperature with its matching average, then connect the points in order using straight line segments.
Common mistakes
- Plotting individual trial results instead of the average for each temperature.
- Using uneven scale intervals or drawing a smooth curve instead of straight lines through the points.