Example 1: Reading the number of glomeruli from a graph
Adapted from June 2019 (R), Paper 2B · Question 3(b)
Question 1
The diagram shows part of a kidney nephron.

The graph shows the effect of age on the number of glomeruli in the kidneys.
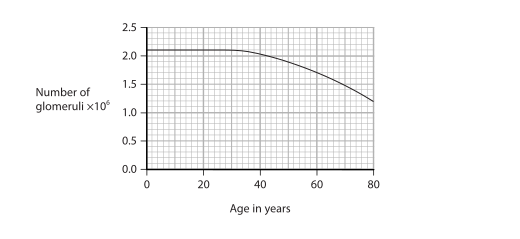
Using the graph, determine the age of a person with 1 600 000 glomeruli in their kidneys.
age = years
Final answer
Age = 65 years.
Mark scheme points
- M1 Read an age between 64 and 66 years from the graph.
Explanation
Find 1.6 million on the glomeruli axis, then read across to the curve and down to the age axis. This gives approximately 65 years.
Common mistakes
- The examiner report noted that almost all candidates read the graph correctly as 65 years. To check your reading, use 1.6 million on the glomeruli axis first, then read the corresponding age on the horizontal axis.