Edexcel IGCSE Biology revision

Movement into and out of cells questions

Distinguish diffusion, osmosis and active transport, and explain changes in cells using concentration differences.

Edexcel IGCSE Biology Subtopic 2.d

Movement of substances into and out of cells syllabus

Questions on movement of substances into and out of cells can test recall, calculations, explanations, diagrams, data handling and practical skills. You should be able to:

  • 2.15 understand the processes of diffusion, osmosis and active transport by which substances move into and out of cells
  • 2.16 understand how factors affect the rate of movement of substances into and out of cells, including the effects of surface area to volume ratio, distance, temperature and concentration gradient
  • 2.17 practical: investigate diffusion and osmosis using living and non-living systems

How to answer movement of substances into and out of cells questions

  1. Name the structure or process precisely before describing its biological role.
  2. When comparing cells, give paired differences and link each adaptation to its function.
  3. For microscopy and transport calculations, show the equation, unit conversion and substitution.
  4. In practical questions, identify the independent, dependent and controlled variables before interpreting results.

Movement of substances into and out of cells example questions and worked answers

These examples show how information in a diagram, graph or experimental context becomes part of a complete exam answer.

Example 1: Explaining osmosis in red blood cells

Adapted from January 2022 (R), Paper 2B · Question 6(c)(ii)

Question 1

A teacher carries out a demonstration to show the effect of different concentrations of salt solution on red blood cells.

This is the teacher’s method.

  • dilute a sample of blood using a salt solution that has the same concentration as blood plasma
  • place 1cm3 of the diluted blood into each of three test tubes labelled A, B and C
  • add 10cm3 of water to tube A
  • add 10cm3 of 1% sodium chloride solution to tube B
  • add 10cm3 of 5% sodium chloride solution to tube C
  • leave each tube for 5 minutes
  • compare the cloudiness of the solutions in the three test tubes
  • take a drop of liquid from each tube and put on separate microscope slides
  • observe each slide under a microscope

After 5 minutes, these are the teacher’s observations.

  • tube A – a clear red solution
  • tube B – a cloudy red suspension
  • tube C – a cloudy red suspension

When the teacher looks down a microscope for cells on each slide, these are the teacher’s observations.

  • slide from tube A – no cells are seen
  • slide from tube B – normal biconcave red cells are seen
  • slide from tube C – red cells are seen but the cells have shrunken edges

The photographs show the teacher’s observations.
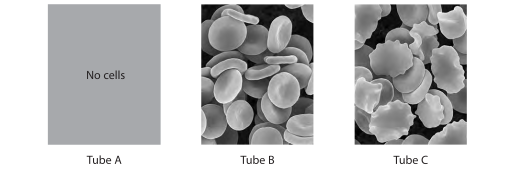
Three microscope views: tube A has no cells, tube B has normal red blood cells and tube C has shrunken cells.
Tube A: no cells · Tube B: normal cells · Tube C: shrunken cells

Explain the differences between the teacher’s observations of the slides from each tube.

Final answer

In tube A, water enters the red blood cells by osmosis, causing them to swell and burst, so no cells are seen. In tube B, water moves into and out of the cells at equal rates, so there is no net movement and the cells remain normal. In tube C, water leaves the cells by osmosis, causing them to shrink.

Mark scheme points

  1. M1 Water enters the red blood cells in tube A.
  2. M2 Water leaves the red blood cells in tube C.

This is one valid full-mark route. The mark scheme awards 2 marks for any two of these references: water enters cells in A; water enters and leaves, or has no net movement, in B; water leaves cells in C; or osmosis.

Explanation

In A, the surrounding distilled water is more dilute than the contents of the red blood cells, so water enters through their partially permeable membranes by osmosis. The cells swell and burst, which explains why none are visible.

In C, the salt solution is more concentrated than the cell contents, so water leaves the cells by osmosis and they shrink. In B, water moves in both directions at equal rates, so the cells keep their normal shape.

Common mistakes

  • The examiner report notes that many candidates correctly linked the missing cells in A to water entering by osmosis and bursting, and identified water leaving cells in C. Make sure your explanation connects the direction of water movement to the observed change.
  • For B, avoid saying that water does not move at all: it moves in and out at equal rates, so there is no net movement.
Example 2: Showing an egg’s change in mass

Adapted from June 2015 (R), Paper 2B · Question 4(b)(ii)

Question 2

A chicken egg is a single cell protected by a shell on the outside.

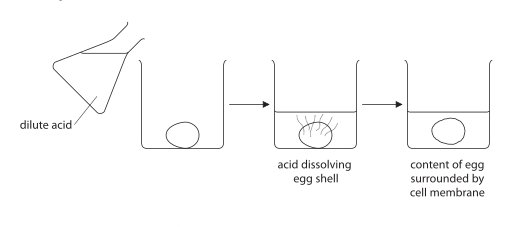
A student puts three chicken eggs into dilute acid and leaves them for three days. The acid dissolves the egg shells, leaving the contents of the eggs surrounded by the cell membrane.

The diagram shows the student’s method.

Diagram showing an egg in dilute acid while the shell dissolves, and the egg contents surrounded by the cell membrane after the shell has dissolved.

The student removes the eggs from the dilute acid and uses water to wash the surface acid away.

The student then uses the eggs for this osmosis experiment.

  • he measures the mass of each egg
  • he then puts one egg into a beaker containing distilled water
  • he puts another egg into a beaker containing 5% salt solution
  • he puts a third egg into a beaker containing 15% salt solution
  • after 15 minutes he removes each egg from its beaker and measures its mass again

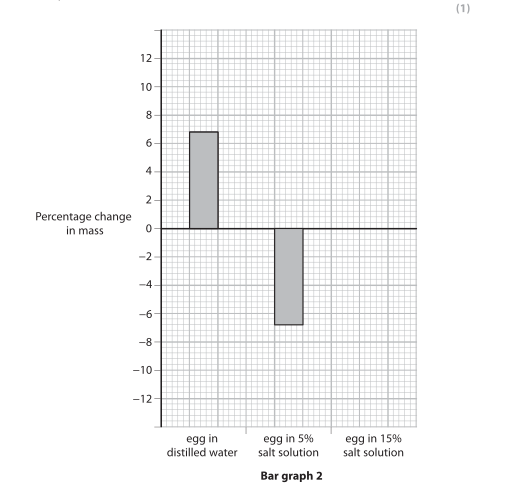
The student calculates the percentage change in mass for the eggs placed in distilled water and in 5% salt solution.

For the egg in 15% salt solution, the student calculates a percentage change in mass of −10%.

Complete the bar graph to show this change.

Bar graph of percentage change in mass, with bars already shown for an egg in distilled water and an egg in 5% salt solution, and an empty category for an egg in 15% salt solution.

Final answer

Draw the bar for the egg in 15% salt solution from 0 down to −10%.

Mark scheme points

  1. M1 The bar reaches −10% (or matches the answer calculated in part (i)).

Explanation

Show the decrease as a bar below zero, ending at −10% on the vertical axis. Water moves out of the egg by osmosis into the more concentrated salt solution, so the egg loses mass.

Common mistakes

  • Check that the bar extends below zero to −10%, rather than showing a positive change or ending at the −5% bar’s value.

Practise Movement of substances into and out of cells questions

Build a focused practice set from this part of the Edexcel IGCSE Biology syllabus.